Este producto ya no se fabrica. Es posible que queden existencias. Consulte las alternativas que figuran a continuación en "Productos similares" o póngase en contacto con nosotros directamente.
Productos alternativos para este producto descatalogado:
S-BTS2048
Application software for BTS2048 variants.
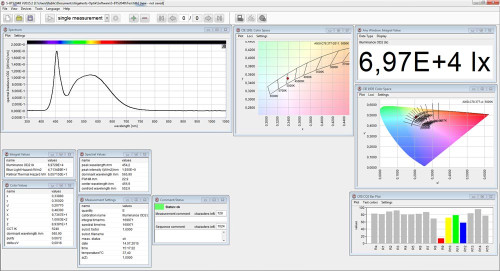
The software allows the full control of the device settings like integration time, measurement settings, mathematical corrections, evaluations, etc. We paid great attention to make the software intuitively controllable and provide an state of the art design. Furthermore we improve our software continuously to provide latest standards and evaluation routines.
Several numerical and graphical displays
The S-BTS2048 software contains several numerical and graphical displays for visualization of your measured data. . These displays are user selected from the view menu and can be positioned anywhere within the application window. Each individual display arrangement can be stored and reloaded. Furthermore two different color schemes are offered, normal and dark room mode with darker background to prevent stray light from the display from reach the detector.
Numerical windows:
- spectral values
- color values (CIE 1931, CIE 1976, CIE 170 (cone fundamental-based evaluation))
- CRI (color rendering index)
- CQS
- intensity and set-up parameters
- commment/status
- measurement settings
- integral values
- TM-30-20 (in older versions TM-30-18 and TM-30-15), CIE224
- etc.
Graphic windows:
- spectral plot
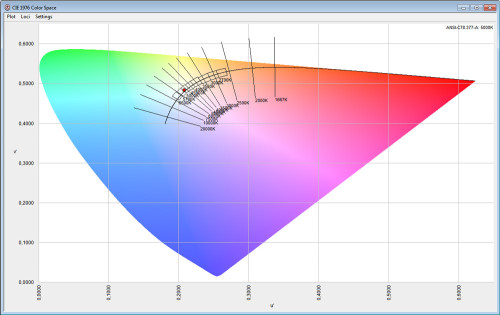
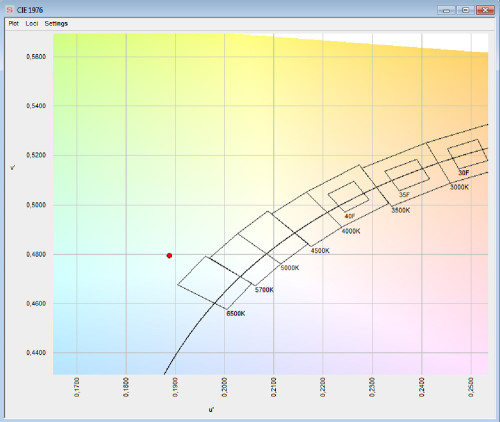
- CIE Chromaticity Diagrams (CIE 1931, CIE 1976, CIE 170)
- polar plot 2D by goniometer measurements
- polar plot 3D by goniometer measurements
- datalogger
- CRI (color rendering index)
- CQS
- TM-30-20 (in older versions TM-30-18 and TM-30-15), CIE224
- L*a*b*
- MacLeod-Boynton Chromaticity Diagram
- etc.
Binning classification
For LED binning additional graphic layers can be shown within the CIE 1931 diagram like the Planckian locus, ANSI or MacAdam Ellipsen. These graphical layers can be used to classify your test samples. Additional layers can be defined by each user individually.
External devices
In addition external devices like power supplies or goniometers can be controleld with the S-BTS2048. As well external devices like a Keithley 2400.
Self-Absorption Correction (Substitution correction)
Re-calibration
Data Export to common file formats
Data can be exported in different formats (IES, Eulumdat, ASCII, Microsoft Excel)IES format (only with goniometer): IES stands for Illuminating Engineering Society. IES standard file format was created for the electronic transfer of photometric data. It has been widely used by many lighting manufacturers and is one of the industry standards in photometric data distribution.
EULUMDAT format (only with goniometer): EULUMDAT is a format for electronic transfer of photometric data. The typical file extension is “*.ldt“. The format was created 1990 and is a de facto standard in European industry.
Database
The S-BTS2048 is bassed on a database architecture, this allows the handling of a large number of measurements. Furthmore datasets can be easily saved, loaded and exported.
Extension tools
The software can be extended by tools like a user control management, automatic complex measurement sequences, etc. Furthermore customized tools can be developed and integrated.
Report Generation
Based on the database an export of measurement data to an Microsoft Word file is provided. The data which is exported is customable by the user.

color schemes
CIEuv1976
CIE 1976
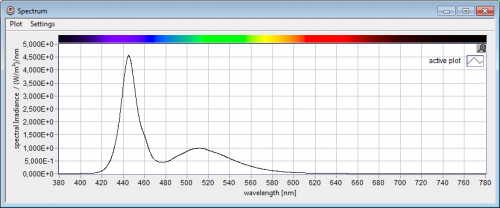
spectral plot
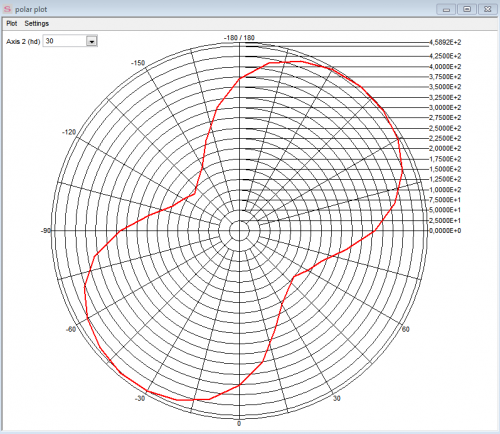
2D Polar Plot
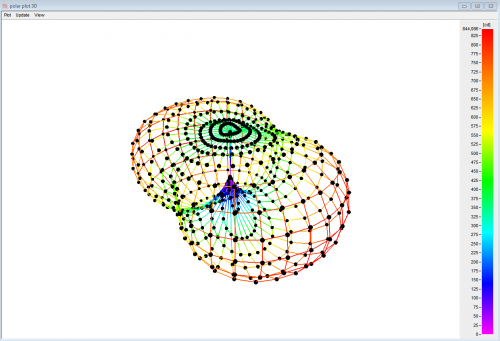
3D Plot
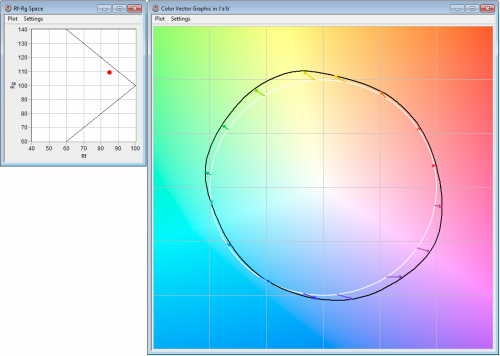
TM-30-15
Productos similares
